Create Chart Using Html Css Javascript (Source Code)
In this article, we create a simple chart📊 using html, css, and javascript. We use an apex chart to create a chart with an awesome effect.
Also, don’t be afraid by name, we just use the CDN link of the apex chart.
So let’s start with a basic html structure for our chart graph.
Html Code
<html lang="en">

<head>
    <meta charset="UTF-8" />
    <meta http-equiv="X-UA-Compatible" content="IE=edge" />
    <meta name="viewport" content="width=device-width, initial-scale=1.0" />
    <title>Chart Using Html Css Javascript</title>
    <link rel="stylesheet" href="style.css" />
  </head>

<body>
    <div id="chart">
    </div>

<!-- JAVASCRIPT -->
<script src="https://cdn.jsdelivr.net/npm/apexcharts"></script>
<script src="app.js"></script>
</body>

</html>
This is our html code, you are just amazed😮 that’s a 1-line html code for our chart project.
Yes, we create just boilerplate code and link css file and javascript file.
Before the javascript file, you can see I linked a CDN that’s the most important part of our chart that we see in the javascript part. So that’s all html code for our chart project.
Css Code
#chart {
  max-width: 650px;
  margin: 35px auto;
}
Amazing🤩 naa🤣, just 1 line Css code. Yes, we use this code to center our chart. Because I say na we use CDN of apex chat, apex chat does everything for us. We just define some things in the chart and everything is ready, so now time to jump on JavaScript🤯.
Javascript Code
var options = {
    chart: {
        height: 280,
        type: "area"
    },
    dataLabels: {
        enabled: false
    },
    series: [
        {
            name: "Follower(Family)",
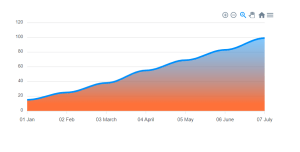
            data: [15, 25, 38, 55, 69, 83, 99]
        }
    ],
    fill: {
        type: "gradient",
        gradient: {
            shadeIntensity: 4,
            opacityFrom: 0.7,
            opacityTo: 0.9,
            stops: [0, 90, 100]
        }
    },
    xaxis: {
        categories: [
            "01 Jan",
            "02 Feb",
            "03 March",
            "04 April",
            "05 May",
            "06 June",
            "07 July"
        ]
    }
};

var chart = new ApexCharts(document.querySelector("#chart"), options);

chart.render();
Yeah, that’s part very important. We use the option in javascript, we define the height and type of chart. Then give chart name like when anyone hovers on any record what shows so just named our chart.
Then write some coloring code like opacity, and shade intensity. And we have an x-axis we write what data we show below step by step like 21,22,23,24 that’s just example work.
Then just get the chart using html to javascript and call the function chart that’s it for our chart graph project.
Here you can below👇 see the complete screenshot and video output of the chart project.
Final Output


You can see when we hover chart everything good. Anyone can’t believe that in less code we create a chart to show some data. So let’s create your own chart and yes you can explore more chart designs and types of the chart on the apex chart website, just search apex chart.
Hope you like this project, we create your own and use this project in any project as a part project like the reviews section, and a contact form. If you need any more project-related frontend. Visit our homepage and you get 100+ projects💝.
if you have any confusion Comment below or you can contact us by filling out our contact us form from the home section. 🤞🎉
Code By – ApexCharts
written by – Codewithrandom


