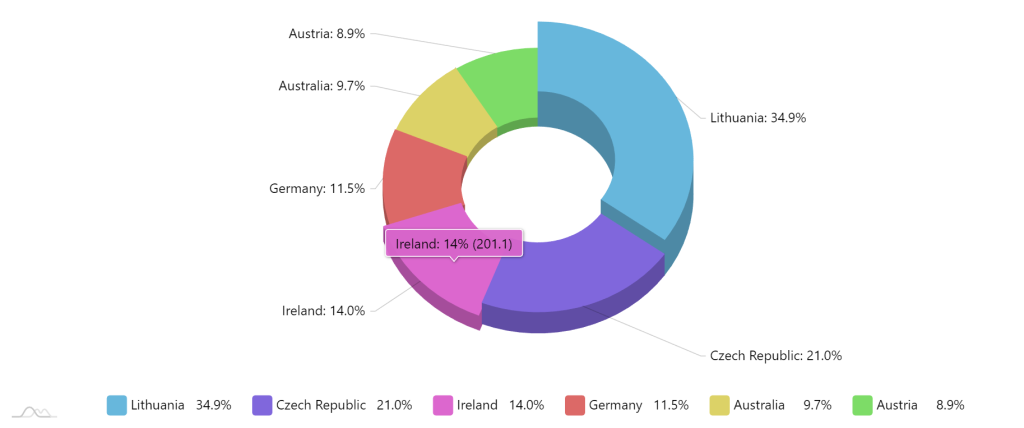
3D Pie Chart Using JavaScript
Hey Guys, Welcome To Our Codewithrandom Blog, In Today’s Blog We Are Going To See How To Create An 3d Pie Chart using HTML, CSS, and JavaScript.

A pie chart is simply an data representation of the formal companies data using colors for values with progress report. Most Of the big companies use these kind of representation to track their progress of data. Like wise we are going to create this project IN A 3D Formation.
So, Let’s Begin Our Pie Chart Representation Project By Adding The Source Codes. For That, First, We Are Using The Html Code.
50+ HTML, CSS and JavaScript Projects With Source Code
Html Code For Pie Chart:-
<script src="https://www.amcharts.com/lib/4/core.js"></script>
<script src="https://www.amcharts.com/lib/4/charts.js"></script>
<script src="https://www.amcharts.com/lib/4/themes/animated.js"></script>
<!-- this all link add in script="" tagm -->
<div id="chartdiv"></div>
Now We have added our HTML Code for the project. In This First We adding an div class with id and then we are adding an plugins for chart and for its animation and that is added using the java script tag.
So the chart and its animate properties were directly added without code. Now we adding CSS just for size and font arrangements.
HTML Output:

CSS Code For Pie Chart:-
body {
    font-family: -apple-system, BlinkMacSystemFont, "Segoe UI", Roboto,
        Helvetica, Arial, sans-serif, "Apple Color Emoji", "Segoe UI Emoji",
        "Segoe UI Symbol";
}
#chartdiv {
    width: 100%;
    height: 500px;
}
Now there is also the CSS code. Nevertheless, for the time being, we only inserted the font family and the width and height of the chart using the #chartdiv property. Here, we will specify the breadth of our chart as “100%” and the height of our chart as 500px using the id selector (#chartdiv).
JavaScript Code For Pie Chart:-
am4core.useTheme(am4themes_animated);
var chart = am4core.create("chartdiv", am4charts.PieChart3D);
chart.hiddenState.properties.opacity = 0;
chart.data = [
    { country: "Lithuania", litres: 501.9 },
    { country: "Czech Republic", litres: 301.9 },
    { country: "Ireland", litres: 201.1 },
    { country: "Germany", litres: 165.8 },
    { country: "Australia", litres: 139.9 },
    { country: "Austria", litres: 128.3 },
];
chart.innerRadius = am4core.percent(40);
chart.depth = 120;
chart.legend = new am4charts.Legend();
var series = chart.series.push(new am4charts.PieSeries3D());
series.dataFields.value = "litres";
series.dataFields.depthValue = "litres";
series.dataFields.category = "country";
series.slices.template.cornerRadius = 5;
series.colors.step = 3;
First In this Java Script code we are calling out the chart properties using a chart as an variable. then we fixing out the chart opacity to zero. As its an plugin we are directly adding values without separate properties.
Create Portfolio Website Using HTML and CSS (Source Code)
Now the code of above explanation is down below.
am4core.useTheme(am4themes_animated);
var chart = am4core.create("chartdiv", am4charts.PieChart3D);
chart.hiddenState.properties.opacity = 0;
Second thing is we are adding data to every contents using data property and inside of data property we are adding separate country names with litres that will be displayed when we hover on it in a 3D formation.
chart.data = [
    { country: "Lithuania", litres: 501.9 },
    { country: "Czech Republic", litres: 301.9 },
    { country: "Ireland", litres: 201.1 },
    { country: "Germany", litres: 165.8 },
    { country: "Australia", litres: 139.9 },
    { country: "Austria", litres: 128.3 },
];
Now the last step is we are adding a code that is used to represent the data in a 3D form when hovering over it. the code looks like a plugin call-out so there is no special property included.
Gym Website Using HTML and CSS (Source Code)
Just calling out colors, data set, values, etc…
chart.innerRadius = am4core.percent(40);
chart.depth = 120;
chart.legend = new am4charts.Legend();
var series = chart.series.push(new am4charts.PieSeries3D());
series.dataFields.value = "litres";
series.dataFields.depthValue = "litres";
series.dataFields.category = "country";
series.slices.template.cornerRadius = 5;
series.colors.step = 3;
ADVERTISEMENT
Video Output 3d Pie Chart Javascript:
ADVERTISEMENT
Final Output Of 3d Pie Chart Javascript:-
Now We have Successfully created our 3D Pie Chart Using HTML , CSS and JAVASCRIPT. You can use this project for your personnel needs and the respective lines of code are given with the code pen section above.
ADVERTISEMENT
If you find out this Blog helpful, then make sure to search code with random on google for Front End Projects with Source codes and make sure to Follow the Code with Random Instagram page.
ADVERTISEMENT
REFER CODE – AG RM
ADVERTISEMENT
WRITTEN BY – Ragunathan S
What is the use of 3D charts?
3D charts are used to define the data in a clear format. By using the 3D representation of the data, the user can easily explain the variability of the data to the clients.
What are the types of 3D charts?
1. Line Graphs
2. Pie Chart.
3. Histograms.
4. Cartesian Graphs


