Data Science is the most booming field in the modern era. The key component of analysis is visualization helps in making complex information accessible and understandable. Among the many tools available for creating data visualizations, D3.js (Data-Driven Documents) stands out as a strong and adaptable toolkit for creating interactive and compelling visualizations directly in web browsers.

In this article, we will explain to you how to create an interactive bar chart using D3.js, providing a hands-on example along the way.
Understanding D3.js
D3.js (Data-Driven Documents) is a JavaScript library used for creating and manipulating data into understandable and easily understandable visuals. D3.js, unlike typical charting packages, allows you complete control over the visual representation by binding data to the Document Object Model (DOM) and then applying data-driven changes to it. We have discussed some of the features below:
- Dynamic attributes: D3 has the ability to provide dynamic attributes to the majority of its functions. Data functions can be used to specify properties. This means that your data can influence your styles and properties.
- DOM Manipulation: D3 helps in manipulating Document Object Model (DOM) based on the data.
- Transitions: The transition() method is provided by D3. This is pretty strong because D3 figures out the logic to interpolate between your values and identify the intermittent states inside.
Example: Interactive Bar Chart
Step 1: Setting Up the Environment
To begin, create the HTML file (index.html) and include the D3.js library. Create an SVG element as well, which will function as the container for our chart.
<!DOCTYPE html>
<html lang="en">
<head>
    <meta charset="UTF-8">
    <meta name="viewport" content="width=device-width, initial-scale=1.0">
    <title>Interactive Bar Chart with D3.js</title>
    <script src="https://d3js.org/d3.v7.min.js"></script>
</head>
<body>
    <div id='bar-chart-container'>
  <div id='bar-chart'></div>
</div>
    <script src="script.js"></script>
</body>
</html>
Step 2: Loading Data and Binding
Load the data into script.js and tie it to the SVG container. Our data will be an array of city objects, each with the name and population of the city.
@import url(https://fonts.googleapis.com/css2?family=Comfortaa:wght@300);

body {
  font-family: 'Comfortaa', cursive;
  background: linear-gradient(130deg,#d04bf8 10%, #70d5ee 80%);

  /*Center  vertically*/
  margin: 0;
  min-height:100vh;
  display:flex;
  flex-direction:column;
  justify-content:center;

  /*Center  horizontally*/
  text-align: center;

}
Step 3: Creating Visual Elements
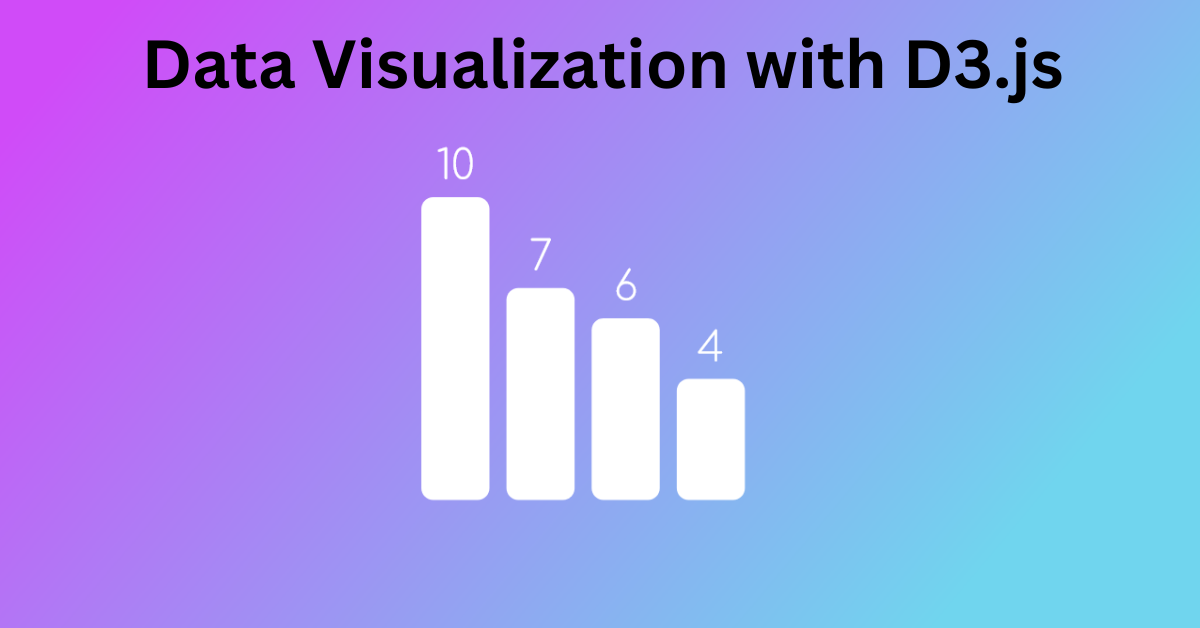
Now, we’ll use the data to construct the visual parts of the bar chart. We’ll draw rectangles (bars) for with different size according to the defined number on the top of the bar.
var drawBarChart = function(){

    /* DEFINE CHART SETTINGNS *************************************************************/

    // Font Style
    var fontFamily = 'Comfortaa', cursive;
    var fontSize = 35;

    // SVG Size & Style
    const width = 450;
    const height = width;
    const widthOffset = 80;
    const heightOffset = widthOffset * 1.2;
    const innerWidth = width - (widthOffset*2)
    const innerHeight = height - (heightOffset*2)

    // Circle Style
    var fill = 'white'

    // Animation
    var delay =  200;

    /* DEFINE DATA ************************************************************************/

    var data = [
        {'key': "A", 'value': 10},
        {'key': "B", 'value': 7},
        {'key': "C", 'value': 6},
        {'key': "D", 'value': 4}
    ]

    /* CREATE SVG  ************************************************************************/

    // Create SVG container
    var svg = d3.select('#bar-chart')
        .append('svg')
        .attr("width", width)
        .attr("height", height);

    // Create axes
    var x = d3.scaleBand().range([0, innerWidth]);
    var y = d3.scaleLinear().range([innerHeight, 0]);

    // Scale the range of the data
    x.domain(data.map(function(d){ return d.key }));
    y.domain([0, d3.max(data, function(d) { return d.value })])

    // Create container for the grid
    var barGrid = svg.append("g")
        .attr("transform", `translate(${widthOffset},${heightOffset})`);

    // Calculate Bar Width
    var barWidth = innerWidth/data.length*0.8

    // Add bars to the bar grid
    barGrid.selectAll("rect")
        .data(data)
        .enter().append("rect")
        .attr("x", function(d){ return x(d.key) })
        .attr("y", function(d){ return y(d.value); })
        .attr("ry", 10)
        .attr("height", function(d){ return innerHeight - y(d.value)})
        .attr("width", () => {return barWidth})
        .attr("fill", fill)
        .attr("opacity", 0.2)
        // Add transition that fades in the bars
        .transition()
        .delay((d, i) => i * delay)
        .attr("opacity", 1)

    // Append value as text to the end of each bar
    barGrid.selectAll("text")
        .data(data)
        .enter().append("text")
        .text((d) => d.value)
        .attr("x", (d) => x(d.key) + barWidth*0.5)
        .attr("y", (d) => y(d.value)-15)
        .attr("text-anchor", "middle")
        .attr('font-family', fontFamily)
        .attr('fill', fill)
        .attr('font-size', fontSize * 0.0)
        .attr('opacity', 0)
Step 5: Transitions and Animations
When the bars are produced or modified, we can provide seamless transitions to improve the user experience.
 // Add transition that fades in the bars
        .transition()
        .delay((d, i) => i * delay)
        .attr("opacity", 1)

    // Append value as text to the end of each bar
    barGrid.selectAll("text")
        .data(data)
        .enter().append("text")
        .text((d) => d.value)
        .attr("x", (d) => x(d.key) + barWidth*0.5)
        .attr("y", (d) => y(d.value)-15)
        .attr("text-anchor", "middle")
        .attr('font-family', fontFamily)
        .attr('fill', fill)
        .attr('font-size', fontSize * 0.0)
        .attr('opacity', 0)
        // Add transition that fades in the numbers
        .transition()
        .delay((d, i) => i * delay)
        .attr('font-size', fontSize)
        .attr('opacity', 1)

}

// Call function to draw the chart once window load is complete
window.addEventListener("load", drawBarChart)Example: Interactive Line Chart
<!doctype html>
<html>
<head>

    <script src="https://d3js.org/d3.v4.min.js"></script>
    <title>Line chart</title>

</head>
<body>

<svg width="400" height="300"></svg>
<script>
        // Step 1
        var dataset1 = [
            [1,1], [12,20], [24,36],
            [32, 50], [40, 70], [50, 100],
            [65, 100], [65, 129], [73, 130],
            [78, 134], [83, 146], [90, 138],
            [100, 140]
        ];

        var svg = d3.select("svg"),
            margin = 150,
            width = svg.attr("width") - margin,
            height = svg.attr("height") - margin

        var xScale = d3.scaleLinear().domain([0, 100]).range([0, width]),
            yScale = d3.scaleLinear().domain([0, 200]).range([height, 0]);

        var g = svg.append("g")
            .attr("transform", "translate(" + 100 + "," + 100 + ")");

        // Title
        svg.append('text')
        .attr('x', width/2 + 100)
        .attr('y', 100)
        .attr('text-anchor', 'middle')
        .style('font-family', 'Helvetica')
        .style('font-size', 20)
        .text('Line Chart');


        g.append("g")
         .attr("transform", "translate(0," + height + ")")
         .call(d3.axisBottom(xScale));

        g.append("g")
         .call(d3.axisLeft(yScale));

        svg.append('g')
        .selectAll("dot")
        .data(dataset1)
        .enter()
        .append("circle")
        .attr("cx", function (d) { return xScale(d[0]); } )
        .attr("cy", function (d) { return yScale(d[1]); } )
        .attr("r", 3)
        .attr("transform", "translate(" + 100 + "," + 100 + ")")
        .style("fill", "black");

        var line = d3.line()
        .x(function(d) { return xScale(d[0]); })
        .y(function(d) { return yScale(d[1]); })
        .curve(d3.curveMonotoneX)

        svg.append("path")
        .datum(dataset1)
        .attr("class", "line")
        .attr("transform", "translate(" + 100 + "," + 100 + ")")
        .attr("d", line)
        .style("fill", "none")
        .style("stroke", "blue")
        .style("stroke-width", "2");

</script>
</body>
</html>
In the line chart, we have done the same thing as we did inside the bar chart:
- First of all, we have imported the D3 libraries into our project.
- Then, using the SG, we will create the structure for our line chart.
- Then, using the script, we will create an array of data.
- Then, using the class selector in SVG, we will load the data inside the structure.
- We will also add the styling using JavaScript only.
To better understand the notion of data visualization using D3 javascript, we advise you to practice with the bar chart first before attempting the line chart.
Conclusion:
D3.js is an effective tool for building dynamic data visualizations that can easily and effectively communicate complex information. We have looked at how to load data, tie it to graphic elements, establish interactivity, and add transitions using the step-by-step example of creating an interactive bar chart. You can share insights, engage audiences, and bring your data to life on the web by becoming an expert in D3.js.
If you find out this Blog helpful, then make sure to search Codewithrandom on Google for Front End Projects with Source codes and make sure to Follow the Code with Random Instagram page.
Follow: CodewithRandom
Author: Arun


